
The election, by the numbers
A STUNNING UPSET

The vote that shook the world.
For the better part of five months, many pundits had been predicting that Hillary Clinton had a nearly insurmountable probability of winning the U.S. presidency. Polls showed her leading Donald Trump for most of the campaign, with many journalists and readers missing the element of uncertainty hidden in the relatively large proportion of undecided respondents.
Pollster Nate Silver, who had so famously gotten the margins right in 2008 and 2012, but missed Bernie Sanders' Michigan upset during the primaries in 2016, tried to warn everyone that probabilities could change. It was the uncertainty factor of 12 percent to 14 percent undecided in most of the polls, he said. He even tweeted a derivation of CUBS morphing into TRUMP to demonstrate that Donald Trump had a just about equal chance of winning as the Cubs had for their final-game World Series coup.
And then, on November 8, the unthinkable happened. Hillary Clinton's blue wall evaporated, and The New York Times' 90 percent probability started plummeting in real time on their web site.
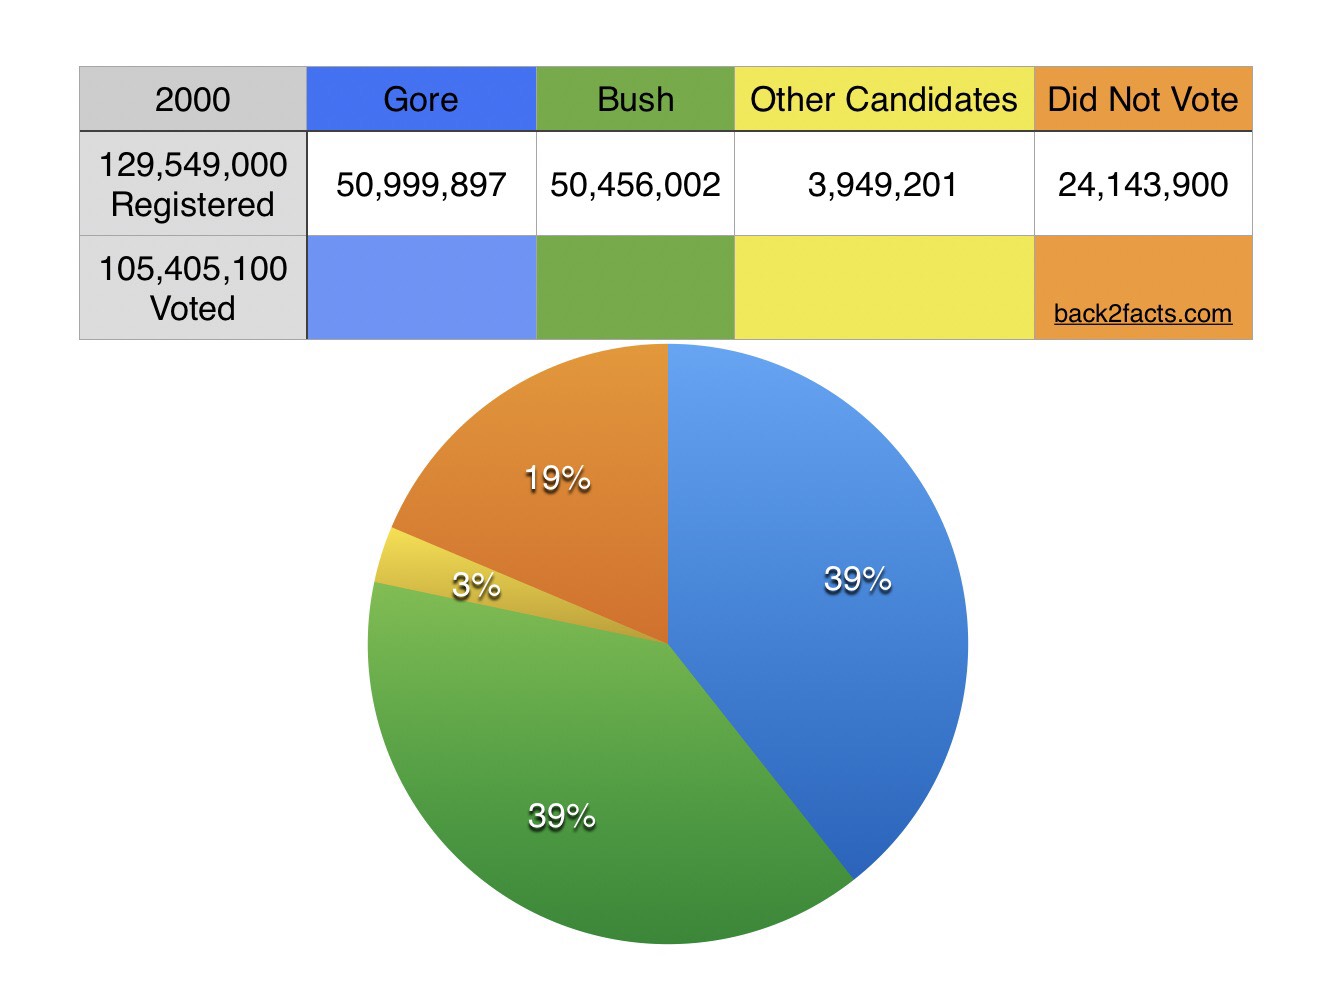
So many post mortems have been written. But one of the starkest post mortems of the 2016 presidential election is the simple pie chart. The pie chart shows how the country is divided -- yes, in a bipolar way, of left versus right, but also in thirds. There were an unprecedented number of non-voters in this election -- a full 32 percent of those registered.
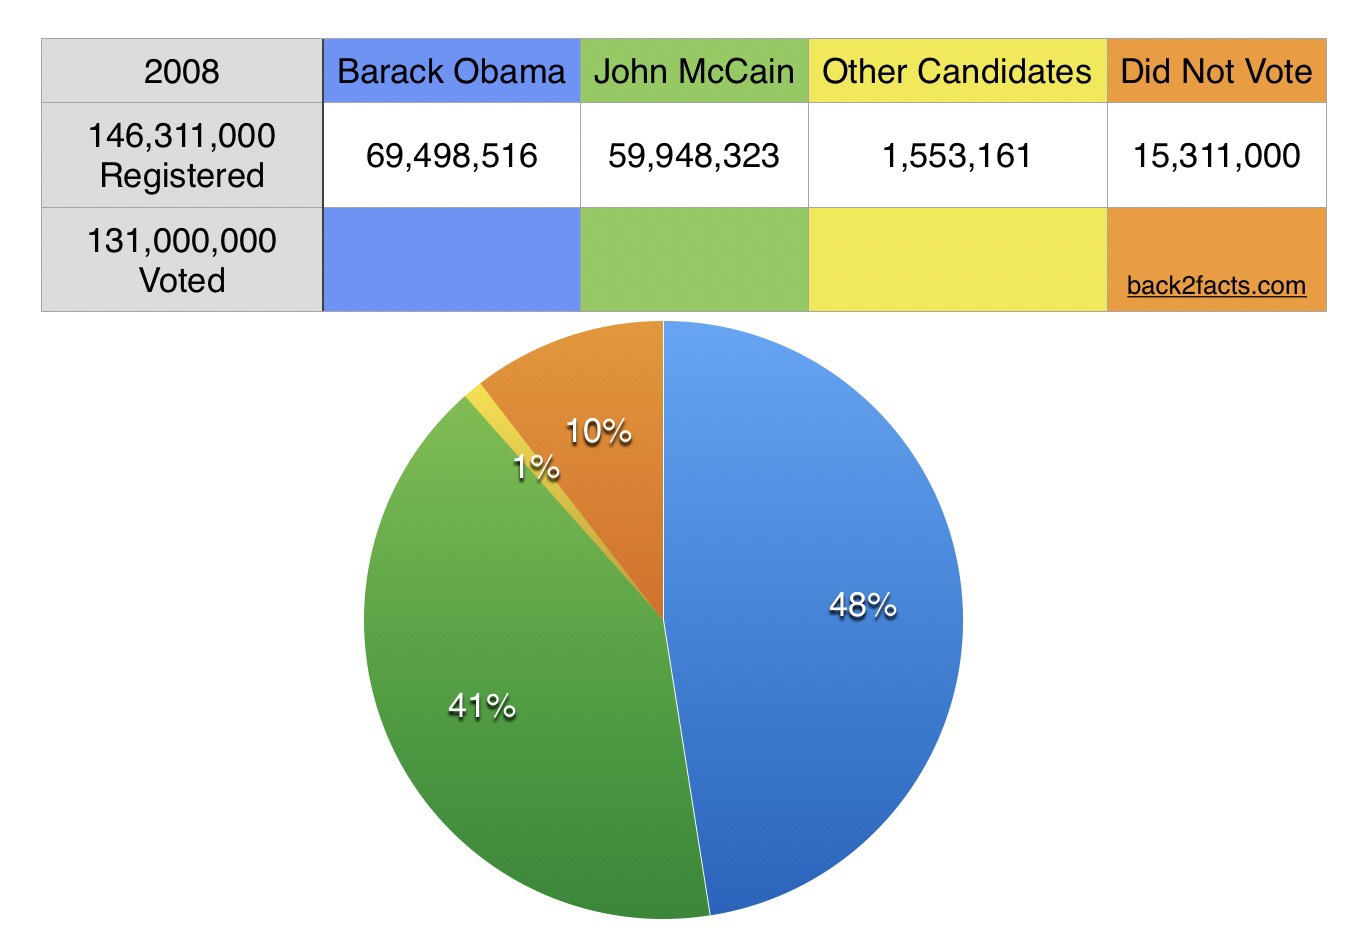
Contrast that with 19 percent in the year 2000, and 10 percent in 2008.
Part of this is because voter registration had grown at a fast clip over the last few years, made easy and automatic through the department of motor vehicles. And part of it can probably be attributed to not only the candidates running, but to the unprecedented amount of vitriol and fake news on social media.
But it is important to note that while Donald Trump lost the popular vote, he won, not just because of the Electoral College in Florida and the Midwest, but because of voter apathy. If you look at it another way, those who voted for a third party, or who did not vote at all, were willing to live with their choice of sending a controversial, politically inexperienced "change" candidate to the White House. So 67 percent of voters did not vote for Hillary Clinton. Sixty-seven percent of voters made a choice against the incumbent party. Sixty-seven percent of voters wanted change. Contrast that with 61 percent in 2000, giving Bush the advantage, and 59 percent in 2008, handing the win to Obama.